Want to Measure Social ROI? Start with These 5 Cross-Channel Metrics

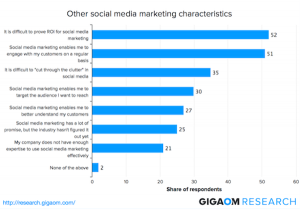
In a recent Gigaom survey, 52 percent of responders stated that, “It’s difficult to prove ROI for social media marketing.” ROI, specifically social ROI, has been a point of contention ever since the term “social media” started surfacing in the marketing circles, dating as far back as 2007-2008.
Why, after almost a decade, doesn’t social media measurement have a solution for measuring ROI? Why is social ROI still such a major challenge?
One of the reasons for the difficulty of measuring social ROI is that data from the networks is both hard to get and hard to connect to a consistent measurement of result.
A limiting factor is the lack of standardization of metrics across all social networks. In a social world in which brands need to communicate with users across multiple networks, the inability to compare apples to apples hinders our ability to truly measure the return.
Standardized cross-channel measurement can be the key to unlock the social ROI potential.
But, cross-channel measurement entails inherent challenges that are not simple to overcome, like aggregation of data from the various networks, standardization of metrics, normalization for comparison, and correlations to identify trends and triggers. With so many challenges, can cross channel measurement really be done? And if so, does it really worth the effort?
Before looking at some solutions, as well as five cross-channel metrics that are relatively easy to gather, standardize, and compare, let’s dig into the reasons for, and the power of, cross-channel data analysis
Social Fragmentation
Social media has evolved to a point where having a Facebook page is not really “doing social” anymore. As users spend more time on social media and diversify their social network usage, sophisticated marketers measure engagement across multiple networks and compare performance to learn what’s working best on what network.
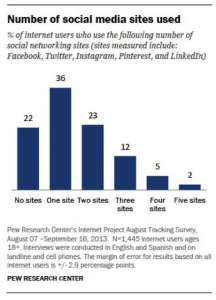
According to the Pew Research Center’s findings, as of January 2014, 74 percent of online adults use social networking sites. Forty-two percent of Internet users use at least two social media sites and more than 53 percent of social media users don’t limit their social media usage to just one network.
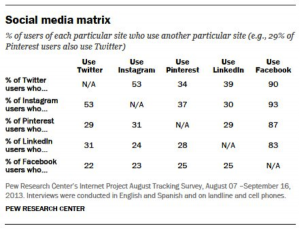
The network overlap is interesting as well. Fifty-three percent of Twitter users also use Instagram (and vice versa) and 39 percent use LinkedIn. Thirty-seven percent of Instagram users also use Pinterest, and only 24 percent of LinkedIn users use Instagram.
And while this research examined only the “top 5” social networks, Wikipedia lists 206 different social networks with an average number of registered users of 46 million (3 million median) and 20 networks with virtual communities of over 100M active users.
With such a proliferation of social networks – not to mention the new ones that emerge every day – can you really focus your marketing efforts on just one network? The people that follow your brand spend time between several social networks and interact with your brand in multiple places.
Audiences view a brand across multiple channels. If this is how your audience behaves, shouldn’t you measure your success in interacting with audiences across multiple channels?
Social Marketers Follow the Trend
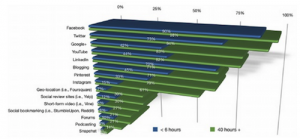
In its annual survey, Social Media Examiner found that to promote their brands, 94 percent of marketers use Facebook, 83 percent use Twitter, and 71 percent use LinkedIn. In addition, the survey found that professional social marketers (marketers investing 40+ hours per week on social) are much more focused on Instagram (46 percent more), Google+ (41 percent more), YouTube (38 percent more), Pinterest (37 percent more) and blogging (26 percent more) than part-time social marketers (those investing 6 or fewer hours a week on social media).
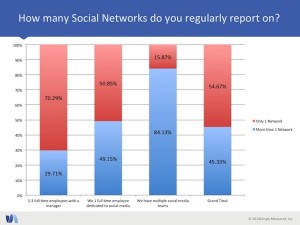
In a recent survey of 1,309 social marketers, Simply Measured found that 55 percent of social marketers report regularly on at least two social networks.
Among brands with more than 50,000 social followers (the sum of all of their brand followers across all social networks), 79 percent of social marketers report on at least two networks with an average of 3.4 social networks per social marketer. Twitter tops the list with 90 percent of social marketers, followed by Facebook (73 percent), Instagram (44 percent) and YouTube (35 percent).
Interestingly, the survey also found that in smaller social teams (2-3 full time employees), social marketers are more likely to focus reporting on one social network. Seventy percent of social marketers in teams of 2-3 social marketers stated that they report on only one network. I believe that this is an indication of specialization in more sophisticated social brands.
Cross-Channel Have You Cross Eyed?
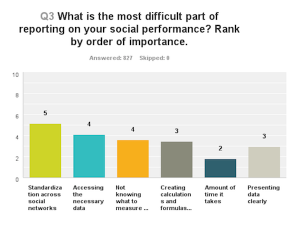
In Simply Measured’s survey, 52 percent social marketers ranked “standardization across social networks” as their number one challenge when it comes to reporting on social media, followed by “accessing the necessary data.”
These results hint that the challenges associated with accessing, aggregating, and standardizing social data, especially across social networks, prevent marketers from accurately (and consistently) report on their results. Whatever the R is in ROI, without a consistent and standard way to report on it, the elusive social ROI will stay as a top challenge.
What’s interesting about the results of this survey is that standardization across social networks emerged as the top challenge for specialized social marketers (responders that stated regular reporting on only one network) even more clearly than for all other marketers.
Among these social marketers, 75 percent ranked standardization across social networks as the top challenge when it comes to reporting on their campaigns. Why would marketers that report only one social network care so strongly about the standardization of data across all networks if they don’t even report on them?
One hypothesis is that these marketers are required to report on the success of their social campaigns and compare them to the results on other networks. In highly specialize social teams (teams with one marketer per network), being able to compare the results you generated on Twitter with the results your colleague generated on Facebook might be the way you would keep your job.
If the road to social ROI goes through standardization of data, what are the most standard metrics in social media?
5 Cross-Channel Metrics to Master
Here are five social metrics that span all networks and can be used to compare performance across channels.
1. Audience Size & Growth (Easy)
Audience size is the easiest social data point to capture and measure over time. It’s public, clear, and by comparing time periods you can easily calculate audience growth rate.
Comparing audience growth rates across social networks can give you the most basic cross channel comparison data point and allow you to start reporting on some level of return from social investment.
Is it important? To some extent audience size is important and the growth of audience (paid or free) could be an indication of brand awareness and increased exposure.
2. Mentions (Easy)
Mentions include keywords, brand, hashtags, and more. Because keywords are universal, comparing brand mentions or campaign-related keywords and hashtags (the social common denominator) could easily serve as a cross channel metric to allow you to compare and report on the results of your campaigns.
3. Engagement (Simple)
Engagement is the all-encompassing metric that represents a response to your social campaigns. Most networks provide “Engagement” data, each with slightly different definitions for the term, which allows you to compare the results across the different networks. If engagement is your desired result, social ROI is within reach.
4. Impressions/Potential Impressions (Tricky)
While impressions are the universal metric for ad platforms, “social impressions” are tricky to standardize. In the timeline heavy UI of most social networks, can you really capture true impressions?
Only recently Twitter updated its analytics UI to include “real” impressions and not potential impressions but this information is only available through your Twitter account and only for Tweets serviced on iOS and Android apps, as well as the Twitter.com web interface.
Therefore, while impressions are a widely acceptable metric to compare activity and performance, aggregating and comparing social impressions is like comparing Fuji apples to Honeycrisp; both apples, they just taste different.
5. Reach/Potential Reach (Hard)
If you find impressions to be somewhat confusing and challenging, reach is by far the most complicated social metric to calculate and therefore compare.
Every network has its unique way of calculating and presenting reach. But while it’s hard to calculate, the concept behind reach is enticing – how many unique people, at a given period, your message reached?
If you’re able to standardize and consistently measure reach, you might be able to have your first real social ROI report.
Conclusion
Starting with these five metrics, social marketers can start building a consistent baseline of reporting on activity and results. Once the social networks standardize around the same set of metrics (similarly to the standardization that occurred in the display and ad networks), the challenge of measuring and reporting on social ROI will become more manageable.
Courtesy: https://searchenginewatch.com/article/2358553/Want-to-Measure-Social-ROI-Start-with-These-5-Cross-Channel-Metrics

